In the previous blog, wediscussed why tracking and reporting GPU Memory Utilization metrics matters. In this blog, we will dive deeper into another critical GPU metrici.e. GPU SM Clock. The GPU SM clock (Streaming Multiprocessor clock) metric refers to the clock speed at which the GPU's cores (SMs)are running. The SM is the main processing unit of the GPU, responsible for executing compute tasks such as deep learning operations, simulations, andgraphics rendering. Monitoring the SM clock speed can help users assess the performance and health of your GPU during workloads and detect potentialbottlenecks related to clock speed throttling.
Why is it Important?
High SM Clock Speed indicates that the GPU is fully utilizing its cores to execute tasks. If the SM clock speed is at or near themaximum, the GPU is operating at full capacity.
- If your workload is performing well, high SM clock speeds are expected.
- If performance is poor despite high clock speeds, other resources (like memory or data transfer) might be bottlenecks.
Low SM Clock Speed indicates that the GPU may not be fully utilized. This could occur because of the following scenarios:
- Thermal Throttling: The GPU may be operating at reduced clock speed to prevent overheating.
- Power Management: The GPU might be under clocked due to power saving measures if the workload does not demand high compute power.
- Low Utilization: If the workload is not compute-intensive or is CPU-bound, the GPU will not require maximum clock speeds.
Thermal Throttling
If the SM clock is lower than expected and the GPU temperature is high (i.e. >80°C), the GPU may be thermally throttling to reduce heat. Monitorthe GPU temperature and improve cooling if necessary.
Power Management Throttling
The GPU might lower the SM clock speed to conserve power if the workload does not demand high performance. This can happen when the system is idle orrunning lightweight tasks.
Performance Bottleneck Diagnosis
If the SM clock speed is high but the workload is still not performing well, it might indicate bottlenecks elsewhere. For example, memory bandwidth orPCIe data transfers may be causing the bottleneck rather than the GPU compute cores. The table below summarizes the typical scenarios where the SMClock metric is instrumental identifying issues.
Real Life Scenarios
Here are two real-life scenarios where the SM Clock metric impacted GPU performance:
High-Performance Computing (HPC) for Weather Simulation
A research institute is running climate models on a GPU cluster to predict weather patterns. These models involve highly parallel computations, whichrequire extensive GPU resources. During one simulation, the researchers noticed that the SM clock speed was consistently high, but GPU utilization waslow.
- Impact Upon investigation, they realized that the workload was memory-bound—meaning that the models were waiting for data from memory (or PCIe) rather than using the GPU's computational power efficiently. As a result, the SM clock speed was high, but the GPU cores weren't being fully utilized. This led to inefficient processing and extended simulation times.
- Solution They optimized the memory access patterns and reduced data transfer bottlenecks, allowing the GPU cores to be more effectively utilized, which in turn improved overall performance.
Deep Learning Training on a Data-Center Scale
A machine learning company was training a large neural network on GPUs in a data center. During the training, the engineers observed that the SM clock speed was fluctuating while the temperature of the GPUs was rising. As training progressed, the SM clock speed would frequently drop, and the performanceof the training process slowed down significantly.
- Impact The team realized the GPUs were experiencing thermal throttling. As the GPU temperature increased beyond safe thresholds, the system automatically reduced the SM clock speed to prevent overheating, thereby decreasing computational throughput.
- Solution The engineers addressed this by improving the cooling system in the data center, which helped maintain the SM clock speed at optimal levels and allowed the training process to proceed without thermal throttling.
In both cases, the SM clock metric provided valuable insights into the underlying bottlenecks, allowing the teams to take correctiveactions to enhance performance.
How Rafay Helps with SM Clock Metrics
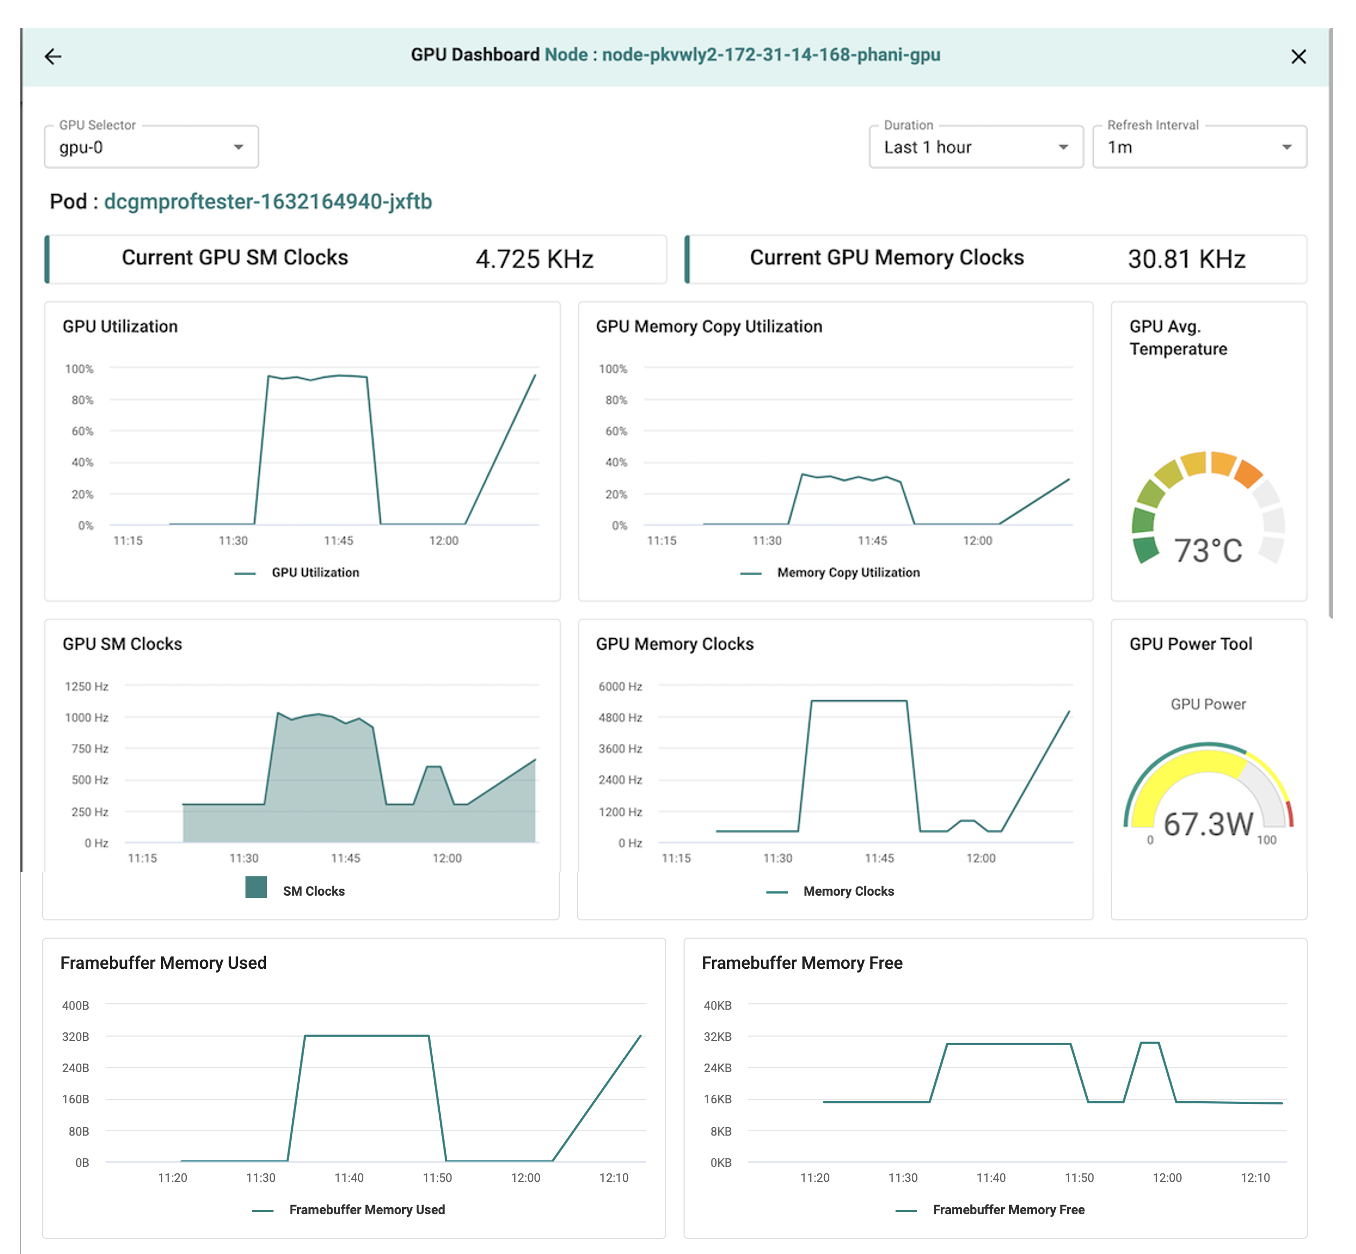
As we learnt in the prior blog, Rafay automatically scapes GPU metrics and aggregates them centrally in a time series database at the Controller. Thisdata is then made available to authorized users via intuitive charts and dashboards. Shown below is an illustrative image of GPU SM Clock metrics fora Nvidia GPU.
Here is a video that showcases how an administrator can use the integrated GPU dashboards to understand metrics like GPU utilization. All the datathey require is literally just a click away.
Conclusion
By monitoring and interpreting SM clock speeds, you can effectively diagnose GPU performance issues, optimize workloads, and ensure that your GPUresources are being used efficiently. In the next blog, we will do a deepdive into the Power Consumption metric.
Sign up for a free Org if you want to try this OR request for a demo OR see us in person at our booth at the NVidia AI Summit in Washington DC from 7-9 Oct, 2024.
Free Org
Sign up for a free Org if you want to try this yourself with our get started guides.
Live Demo
Schedule time with us to watch a demo in action.
Rafay's AI/ML Products
Learn about Rafay's offerings in AI/ML Infrastructure and Tooling
Upcoming Events
Meet us in-person in the Rafay booth in one of the upcoming events